
Comparative framing
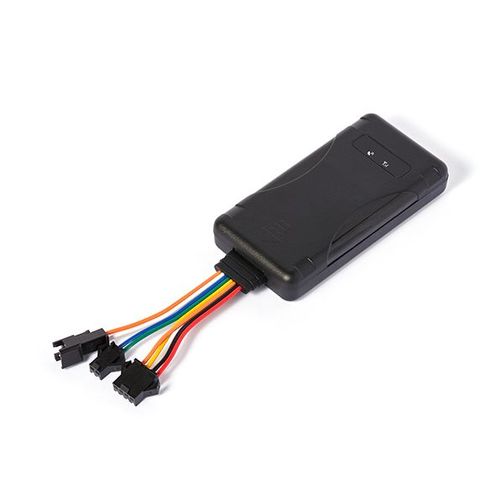
Public transit operators face a simple investment question: centralize control or outsource capabilities. I compare the two directly so an investor can see where value hides. Early on, operators choose between in-house software stacks and partnerships with third-party fleet telematics technology providers; that choice determines data ownership, upgrade cadence, and capital allocation. Consider New York City’s MTA bus network as an example of scale where decisions about telemetry, routing, and maintenance translate into measurable operational risk and capital needs.
Core terms tied to investor metrics
Definitions matter because each term maps to cost or revenue drivers. Below are concise definitions with the financial implication that follows. The fleet tracking system link points to an implementation example that clarifies vendor scope.
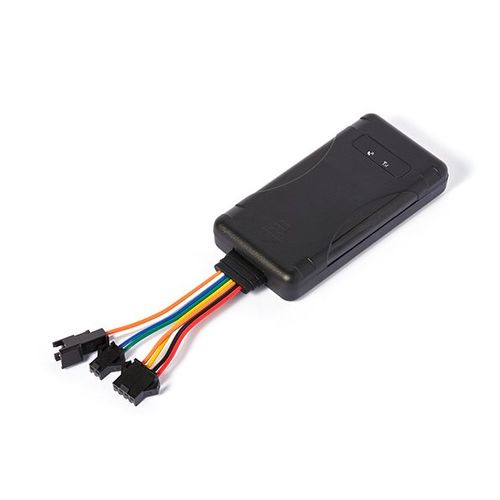
– Telematics: vehicle-level sensors, GPS, and cellular connectivity. Financial implication: recurring connectivity fees and hardware capex.
– AVL (Automatic Vehicle Location): time-stamped positions used for on-time performance. Financial implication: impacts fare revenue and service-level penalties.
– TMS (Transit Management System): scheduling and dispatch software. Financial implication: affects labor productivity and route efficiency.
– Predictive maintenance: algorithms that forecast failures. Financial implication: lowers unscheduled downtime and maintenance spend.
– Data ownership: who holds raw telemetry. Financial implication: controls future monetization and vendor dependency. See a typical fleet tracking system implementation to align these terms with real modules.
Model comparison: agency-run, operator-run, third-party managed
Compare models by four hard metrics: Total Cost of Ownership (TCO), time-to-value, control over data, and upgrade velocity. Results are direct and non-negotiable.
– Agency-run: maximum control, higher front-loaded capex, slower upgrades. Suits agencies that need data sovereignty and can absorb capital expense.
– Operator-run (private operator under contract): balanced capex and opex, moderate flexibility. Works where labor and route decisions are bundled into a concession model.
– Third-party managed (SaaS + managed services): lowest time-to-value, higher recurring costs, potential vendor lock-in. Best when rapid modernization and predictable opex are priorities.
Performance indicators investors should demand
Ask for measurable KPIs, not promises. These drive valuation and post-acquisition integration plans.
– On-time performance (OTP) delta after deployment — target is a quantifiable percentage improvement.
– Mean time between failures (MTBF) for critical subsystems tied to maintenance savings.
– Data latency and packet loss rates — affect real-time dispatching and rider information.
– Customer-facing uptime for passenger apps — directly correlates with ridership retention.
– Total monthly recurring revenue (MRR) from telematics subscriptions if the operator resells data services.
Common pitfalls and where value erodes
Neglect these and upside evaporates quickly.
– Treating telematics as hardware-only. Without analytics, telematics produce cost, not insight.
– Overlooking integration costs with legacy fare and scheduling systems. Integration overruns are typical and material.
– Ignoring data governance. Poor governance creates regulatory and commercial risk.
– Rushing to the cheapest vendor. Short-term savings can produce long-term vendor lock-in and migration costs.
Decision checklist for procurement and investment
Use this checklist to cut ambiguity when you evaluate deals or bids.
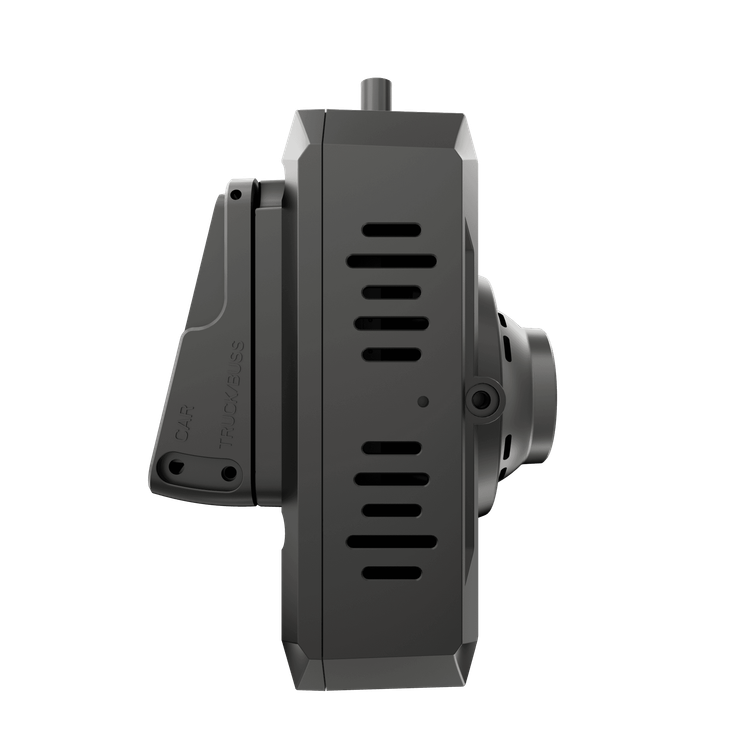
– Confirm data ownership clauses and export formats.
– Require SLA metrics tied to payments (latency, uptime, support response).
– Model three-year TCO including cellular plans and cloud costs.
– Validate predictive maintenance accuracy with historical failure data.
– Run a pilot on a representative route, not a benign route, and measure OTP and downtime impact.
Conclusion: where the strategic value sits
Compare options against the four investor metrics and you get straight answers: control, cost, speed, and risk. Decisions that concentrate on measurable KPIs and clear data rights produce predictable returns. That predictable return is the actual product investors buy when they fund transit modernization projects tied to telematics; companies that present those outcomes credibly, with operational evidence, create the most durable value—just the kind of offer that makes a firm like BSJ a natural integration partner rather than a speculative bet.